# Debbuging
# What’s Debugging?
Normally, when we build software we face issues and we make mistakes, we’re human after all, that’s why debugging is so important: it lets us pinpoint exactly what our error was and where it’s located. Debugging is a process where we run our code specifically searching for errors. You do not debug unless you know there’s one or more errors in the software you’re building.
# Error types
There are two types of errors: syntax errors and logical errors.
- Syntax errors are normally related to typos or a missing syntax in your code. For example, in JavaScript you could forget to close a string when you miss quotation marks, for instance:
const a = {
	something: "something
}

console.log(a.something);
- Logical errors are trickier, when you have one of these, your code is written correctly and it runs without failure but it’s not doing what it’s supposed to do. If you have an algorithm for sorting an array for example, if you use it and the resulting array is not sorted correctly then you have a logical error. The code works in a strict sense, it does what it’s written on it to do but it doesn’t solve the problem you had before you started writing it.
# Debugging in JavaScript
The process of debugging in JavaScript is varied, there’s no one true way to do it, there are options and different techniques you may employ, we’ll explain some of the most common ones here.
# Console Logging
This debugging practice is very common in all programming languages. You simply print out to your console the values of variables while your program is running. When you do this you get a sense of what's going on, you can see how the values of the variable change, the previous values that it had and you can catch execution errors as well.
You can access your browser’s console by hitting F12
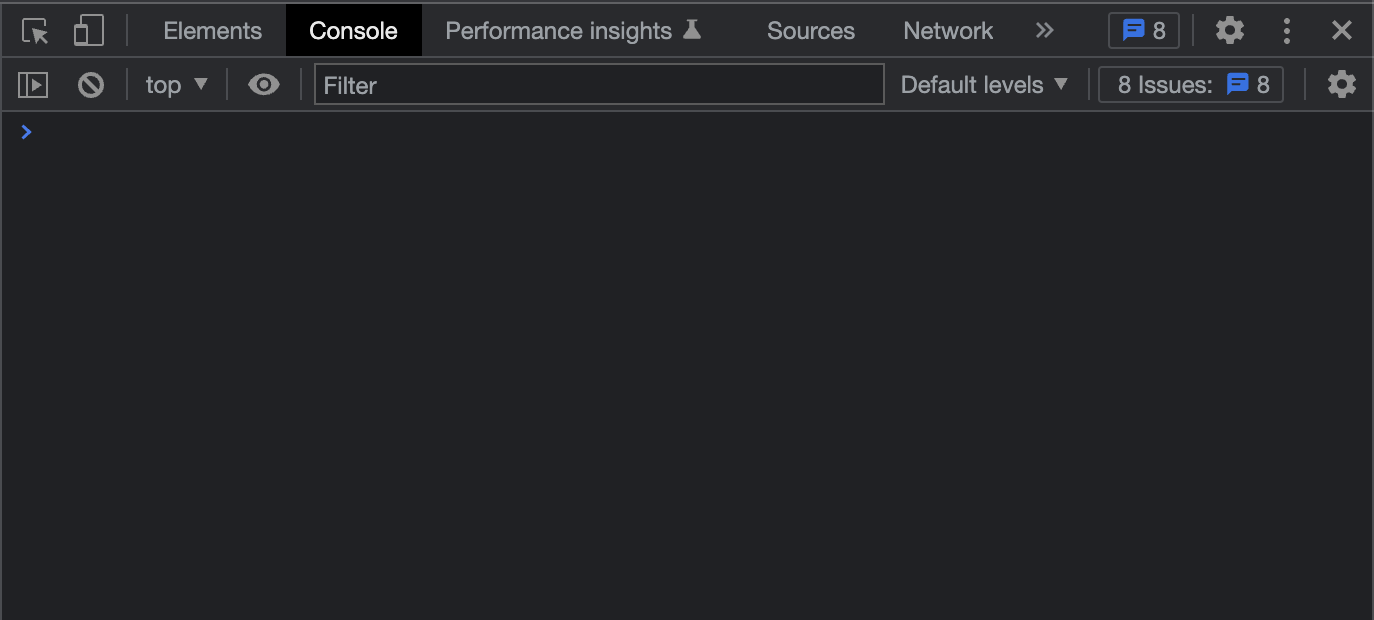
You can use the console object in order to control the output in the browser console. The most basic command is console.log(“something”) , this will print out whatever you pass to the method as an argument.
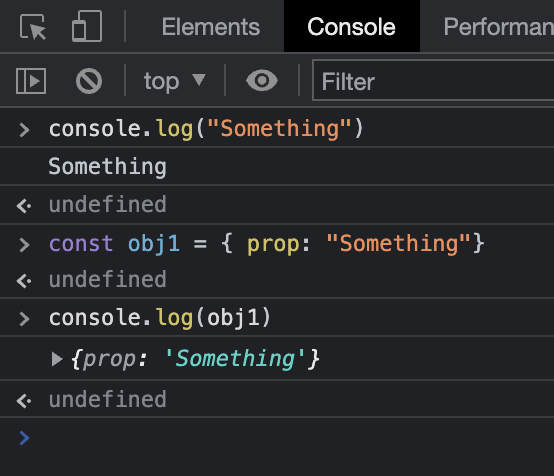
Now, let’s use the console in order to debug a simple program. When you write code, it’s really common to make mistakes that aren’t easy to figure out. Let’s say you write a function that takes an array of numbers as a parameter and returns an array with the same numbers but in increasing order, so, if I gave it an array like [2,4,3,5,1] it should return [1,2,3,4,5].
function sort(arr) {
  const newArr = [];
  while (arr.length > 0) {
    let lowestValue = 99999999;
    let lowestValueIndex = -1;

    for (let i = 0; i < arr.length; i++) {
      const element = arr[i];

      if (element < lowestValue) {
        lowestValue = element;
        lowestValueIndex = i;
      }
    }

    newArr.push(lowestValue);
  }
  return newArr;
}

const arr = [2, 4, 3, 5, 1];

console.log(sort(arr));
This should do it. When we move to testing we realize that this function is causing the browser to load forever. A simple function that sorts an array couldn’t take this long to do it, it should be instantaneous. We have a bug, a logical error as a matter of fact, we shall now proceed to debug it using the console. The information that we get from the logs should guide us to the reason why it’s failing. Let’s add some logs to the function, we choose the most important variables and parameters in it: arr, lowestValue and lowestValueIndex.
function sort(arr) {
  const newArr = [];
  while (arr.length > 0) {
    let lowestValue = 99999999;
    let lowestValueIndex = -1;
    console.log("Step 1: " + arr);
    for (let i = 0; i < arr.length; i++) {
      const element = arr[i];

      if (element < lowestValue) {
        lowestValue = element;
        lowestValueIndex = i;
      }
    }
    console.log(
      "Step 2: Lowest value is " +
        lowestValue +
        ", lowest value index is " +
        lowestValueIndex
    );
    newArr.push(lowestValue);
  }
  return newArr;
}

const arr = [2, 4, 3, 5, 1];
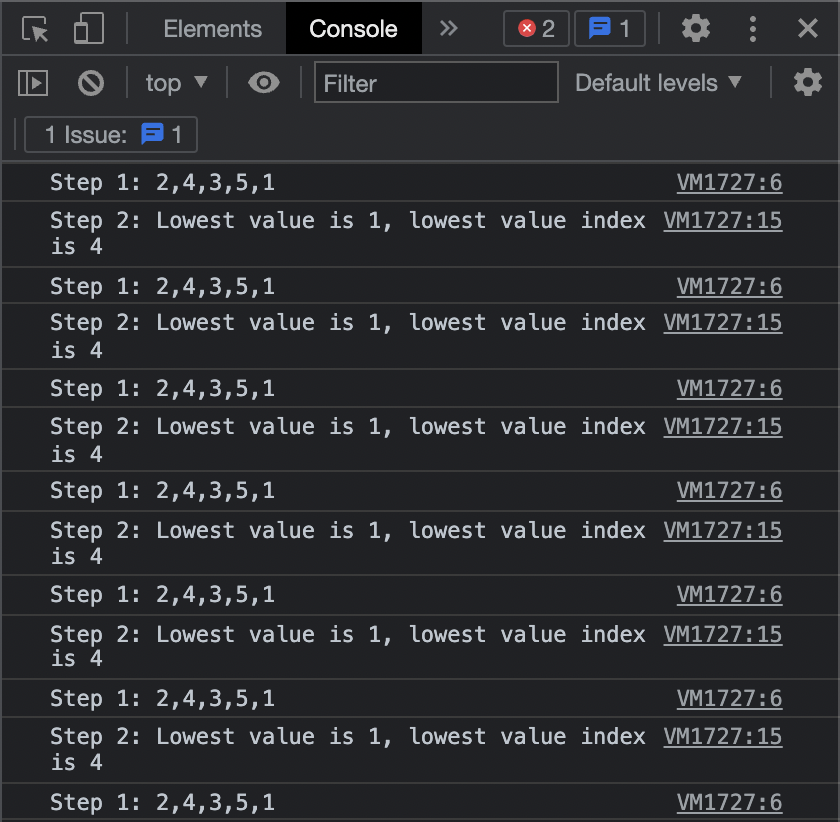
Seeing this we realize that the array is never changing throughout the iteration of the while loop. Because of the condition in the aforementioned loop, it’s never going to stop iterating. This is known commonly as “while true”, a never ending loop that halts the program entirely and sucks up resources indefinitely. Thanks to our logs we were able to see this. Now let’s fix it:
function sort(arr) {
  const newArr = [];

  while (arr.length > 0) {
    let lowestValue = 99999999;
    let lowestValueIndex = -1;

    for (let i = 0; i < arr.length; i++) {
      const element = arr[i];

      if (element < lowestValue) {
        lowestValue = element;
        lowestValueIndex = i;
      }
    }

    newArr.push(lowestValue);
    arr.splice(lowestValueIndex, 1);
  }

  return newArr;
}
const arr = [2, 4, 3, 5, 1];

console.log(sort(arr)); //[1,2,3,4,5]
Now it’s working and we were able to debug the error using the console.
TIP
If you're interested, you can always check console (opens new window) documentation where you will see a lot of different ways to show the data you want.
# Built-in Debugger
Now, we’re moving on to a more sophisticated way of debugging javascript code in the browser: the built-in debugger. This contraption allows us to stop our program while it’s running, exactly in the spot we tell it to. It can also show us importation information about the execution scope like the value of the variables, parameters and the context. Let’s take the same example as before with the same error, but this time we’ll debug it with the debugger:
function sort(arr) {
  const newArr = [];

  while (arr.length > 0) {
    debugger;
    let lowestValue = 99999999;
    let lowestValueIndex = -1;

    for (let i = 0; i < arr.length; i++) {
      const element = arr[i];

      if (element < lowestValue) {
        lowestValue = element;
        lowestValueIndex = i;
      }
    }

    newArr.push(lowestValue);
  }
  return newArr;
}
We add “debugger”, a javascript keyword, to the beginning of the while loop. We open the page where this is running and hit F12. Once the execution reaches the point where the debugger has been put, it should show something like this (The window can vary from browser to browser but it should have the same controls):
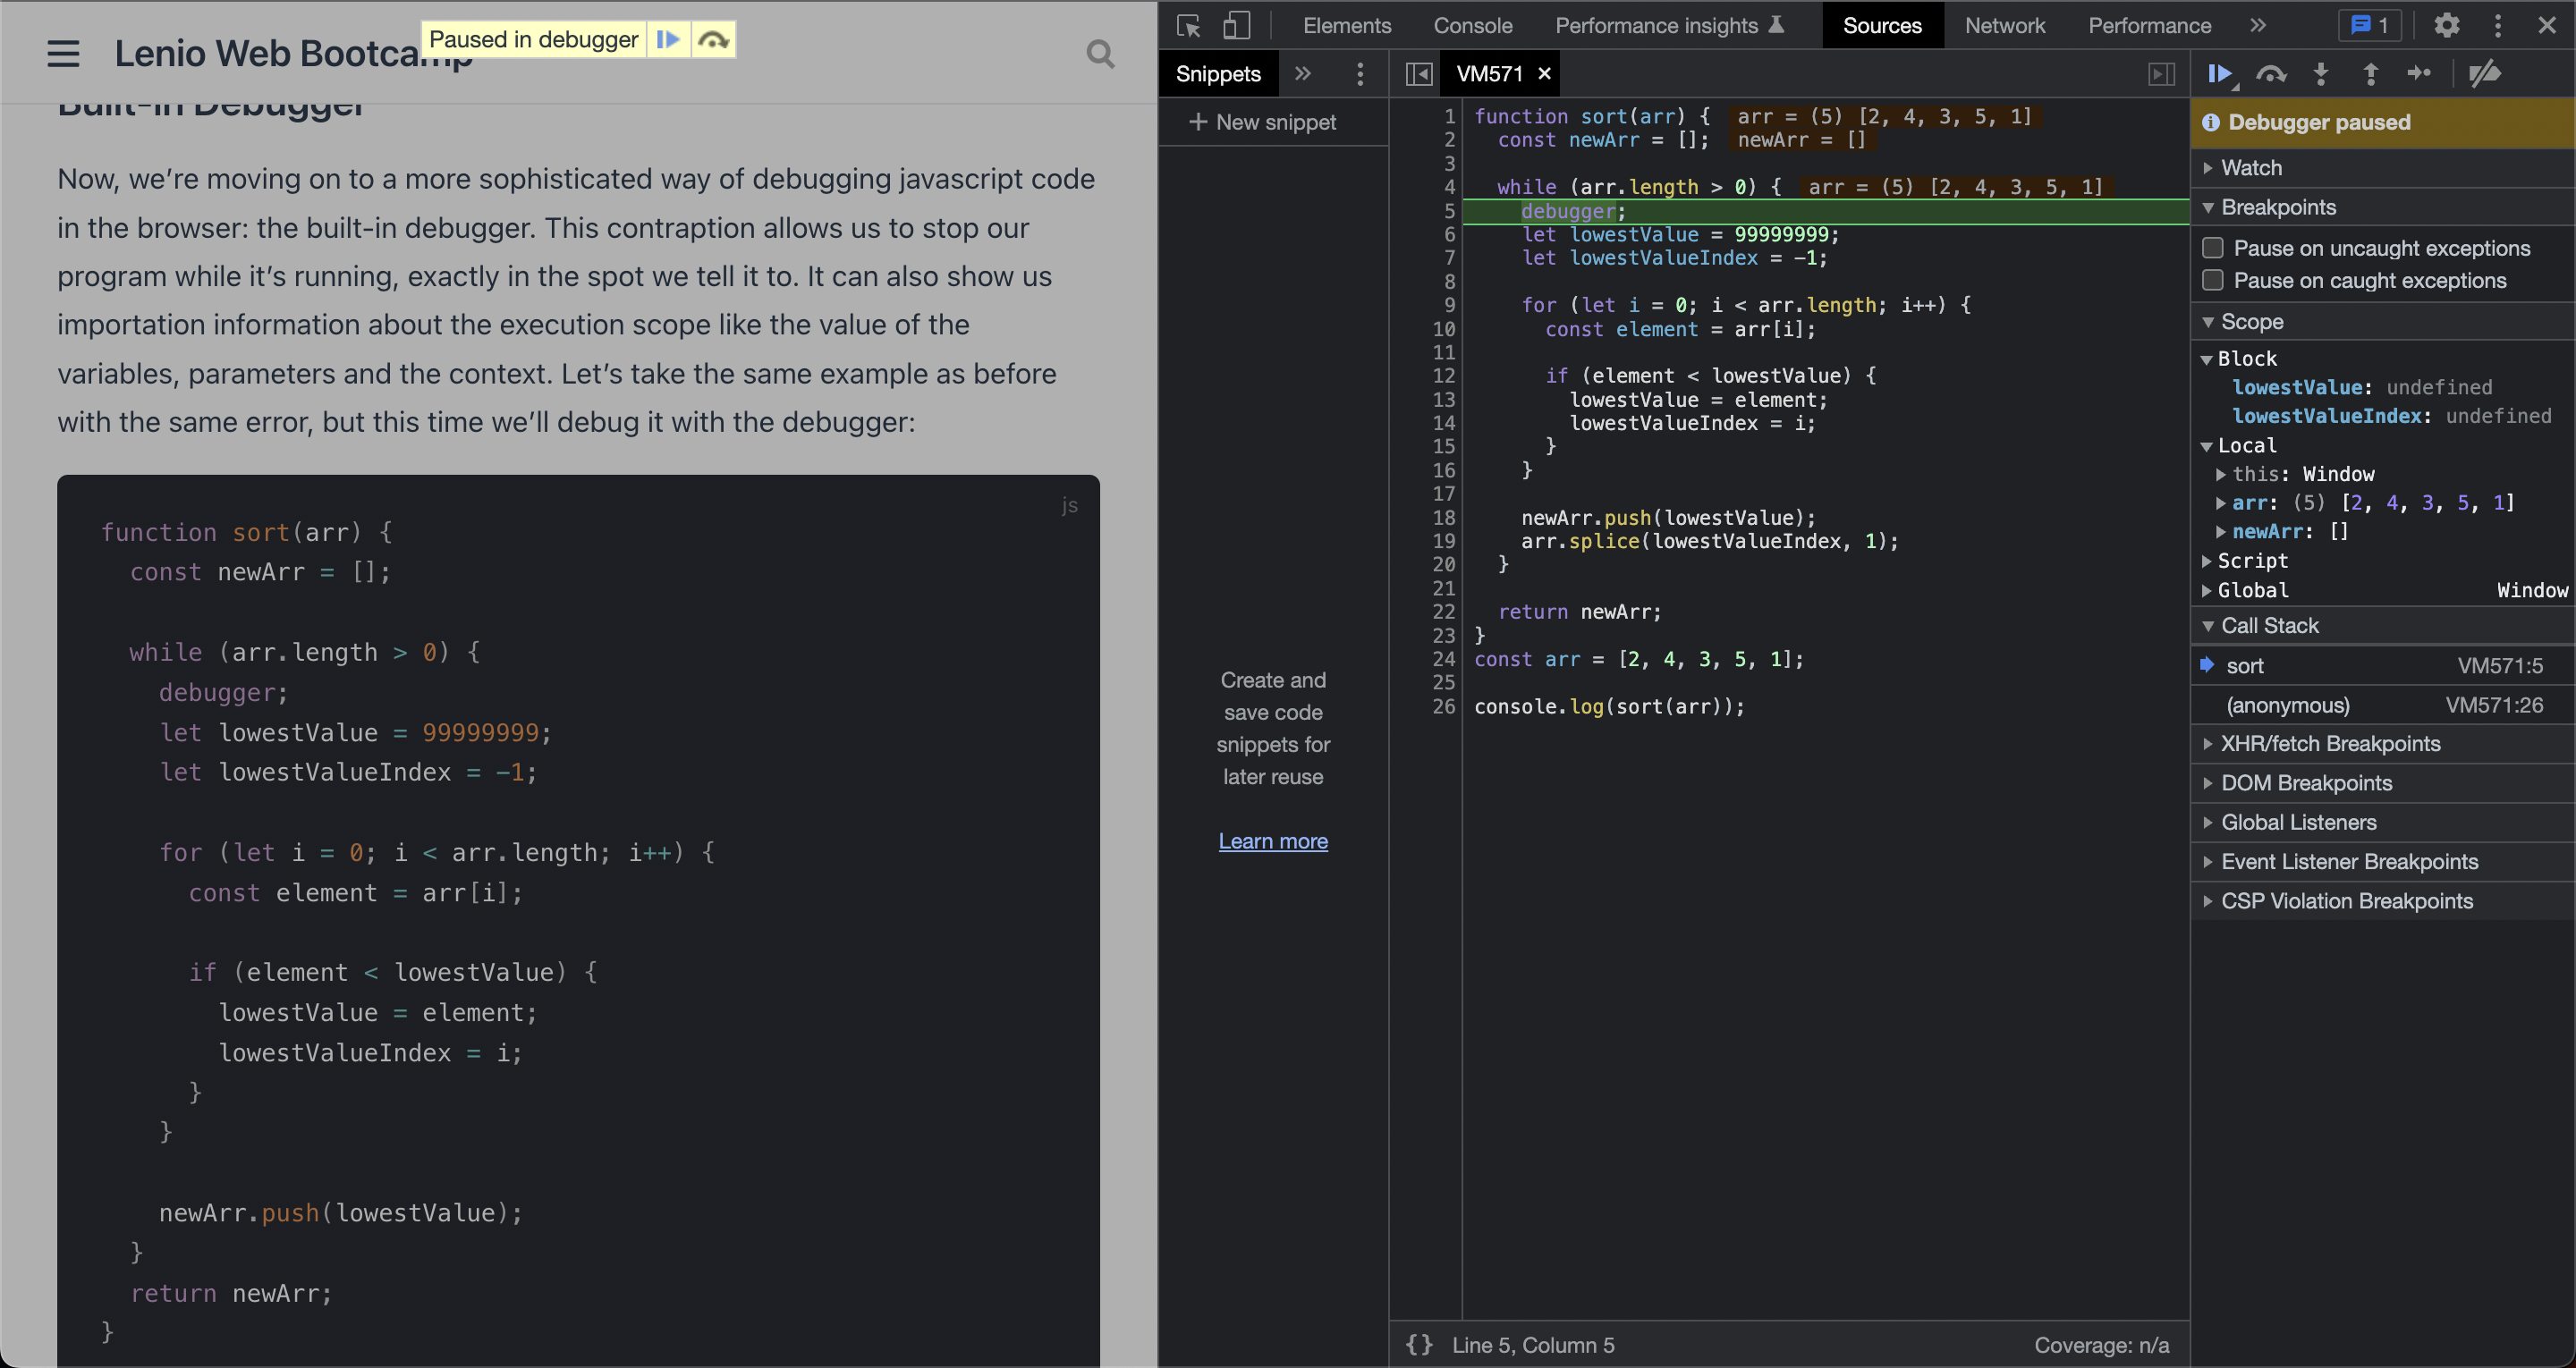
We have these buttons that lets us control the execution of the program:

The first button tells the browser to resume execution as it normally would. The second button tells the browser to execute the current line of code and move to the next one, this allows us to see step by step how the values in our code changes. The third button will move execution to a deeper scope based on what functions and methods are going to be runned in the next lines. The last one does the opposite, it takes us to a higher execution scope.
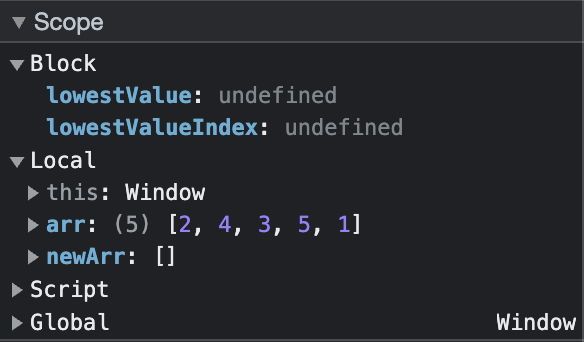
This window shows us the execution stack, the variables and their values.
With all of this control over the running program we can inspect the values that our variables and objects take in every step of our program’s execution. If we think our program does something but we’re getting an error, we should use the debugger and verify our hypothesis. If your values are not changing in the way you thought they would, then it’s very likely that you have an error and the debugger can help you in finding it.
With the previous example it is very clear where the error it’s located, you can almost figure it out without having to debug in the first place. Logging and the debugger come in handy when you’re working on something bigger, a more complex app, with more layers, with multiple variables and objects can be very hard to follow on your own when you’re trying to fix a bug. These tools are a great aid in that task. Use them as much as you can.